Correcting technical artifacts: The case of ambient gene expression
There are many ways to crack a nut, but without the right tool none are easy.

On a stormy sea "of ambient gene expression" a scientist is bailing out water (ambient expression) from his sinking boat (sequencing droplet containing a cell).
In this blog post, I will discuss the limitations of commonly used methods for correcting a technical artifact known as ambient gene expression (AGE). Although this artifact is specific to single-cell transcriptome sequencing (scRNA-seq) data, the approaches for its modeling and mitigation resemble domain correction and adaptation approaches used for other data types. Those in the single-cell field may recognize AGE as a component of “batch effects”.
The limitations of the AGE correction methods discussed in this blog post are largely based on my own experience. The AGE biases were one of my greatest enemies while analyzing my scRNA-seq pancreatic atlas (Hrovatin, 2023), especially when interpreting differential gene expression (DE) results. Thus, I tried out various correction methods. I tested multiple correction tools (SoupX, DecontX, and CellBender) in the autumn of 2020 and later alternative approaches for mitigating AGE. For this blog post, I again reviewed the literature in the autumn of 2024.
While I discuss the solutions on which I decided, I must admit that I am not fully satisfied with them. - So do not consider them as set in stone, but rather as something to ponder over.
Sections list
- What is ambient expression?
- Methods for AGE correction
- Aligning AGE correction methods with downstream data use cases
- AGE correction as a pre-processing step for data integration
- Challenges of AGE correction for DE analysis
- Effect of AGE on DE analysis
- Limitations of AGE correction methods for cross-batch comparison
- Removing likely ambient genes from DE analysis
- Excluding genes whose DE can be explained by ambient DE
What is ambient expression?
It is important to understand the general characteristics of AGE (Figure 1) as they are used as inductive biases in AGE correction approaches.
Brief introduction of scRNA-seq
- Cells and droplets are samples.
- Batches or sequencing samples are domains.
- Genes or their transcripts are features.
Tissues contain multiple classes of cells with similar functions and gene expression, called cell types. However, the gene expression of two cells from the same cell type will never be the same due to:
- The noisiness of biochemical reactions (i.e. probabilistic nature of gene expression).
- Underlying biological differences, which depend on cell type annotation resolution.
- Technical effects.
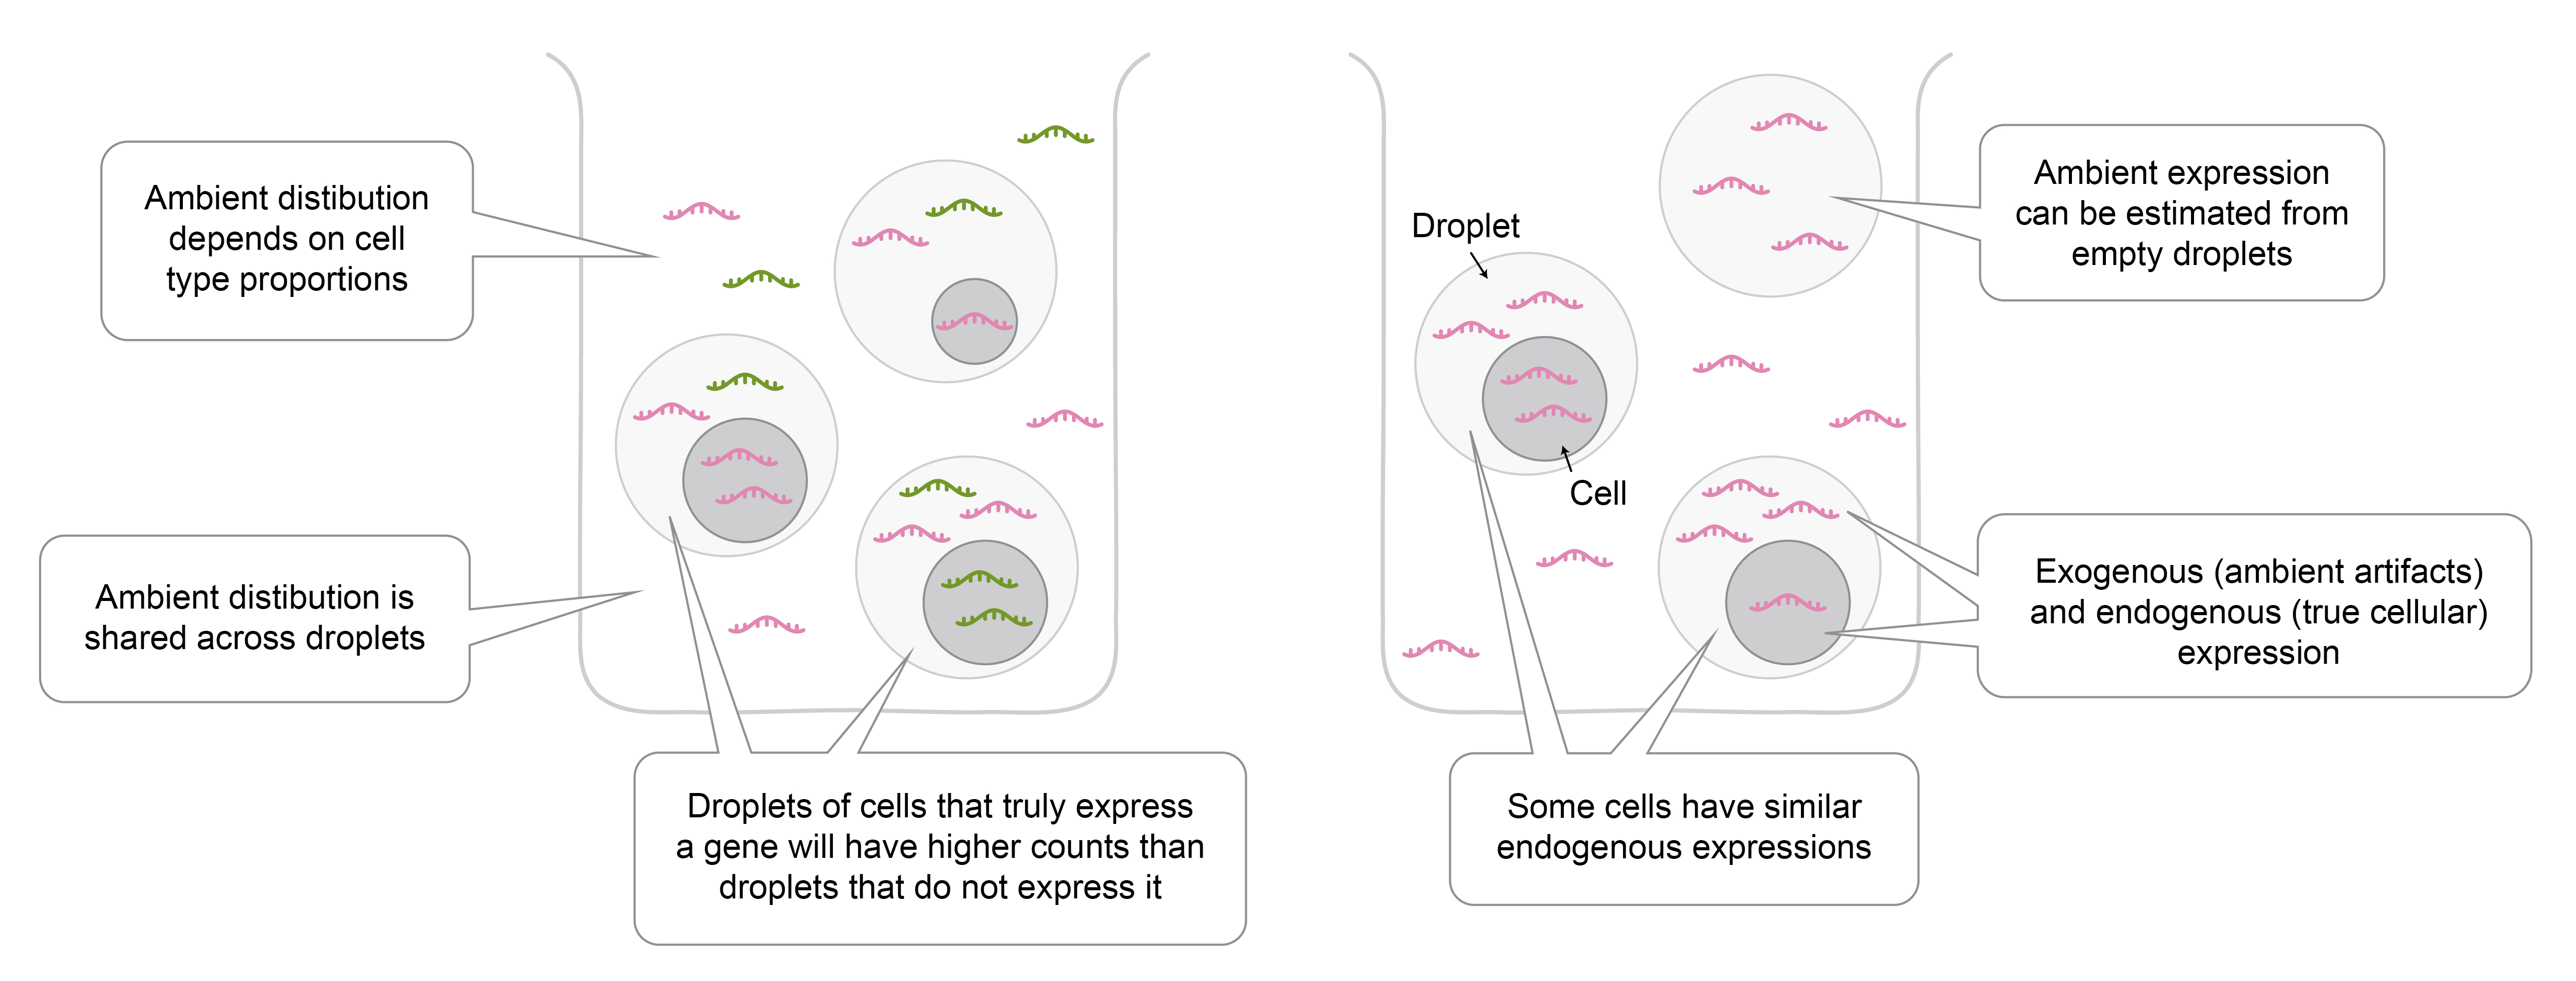 Figure 1: Properties of ambient gene expression.
Summary of AGE characteristics:
- Data of each cell can be, in theory, decomposed into endogenous (true) and exogenous (ambient artifact) components1.
- Cause of AGE: Besides the cell and its endogenous transcripts, each droplet will also contain some of the liquid in which cells are dispersed during sample preparation. As some of the cells burst during processing, their RNA will be released in the solution and subsequently captured within droplets, representing the exogenous “ambient” RNA.
- The underlying AGE distribution is shared across all droplets processed in the same batch (e.g. test tube), but the final measured AGE differs between droplets.
- Shared distribution: Every test tube contains multiple cells that will be encapsulated into droplets, and for them, the exogenous molecules that are captured within the droplet are sampled from the same distribution.
- Observation differences: The measured AGE will differ across cells for several reasons: First, the ambient transcripts captured in each droplet will vary due to sampling randomness. Second, the relative number of exogenous transcripts compared to the endogenous transcripts will be affected by cell-specific factors, such as cell size.
- Droplets of cells that truly express a gene will have higher counts for that gene than droplets of cells that do not express that gene, containing only exogenous transcripts.
- Some cells have similar endogenous expressions.
- Joint modeling: Biologically related cells are expected to share the underlying distributions from which the measured endogenous as well as exogenous transcripts are sampled. Thus, gene expression characteristics can be modeled jointly in similar cells.
- The underlying AGE distribution can be estimated from the data.
- Empty droplets: Some of the measured droplets will contain no cells and they can be identified by a low number of transcripts. The transcripts within these droplets thus represent AGE within the batch.
- The composition of AGE strongly depends on cell type proportions within the batch.
- Deviation from cell type proportion relationship: Cells from different cell types have distinct AGE contribution properties. For example, they differ in the likelihood of bursting and cell size, which determines the number of transcripts released into the solution upon bursting. Thus, AGE distribution cannot be directly approximated by cell type proportions.
Methods for AGE correction
Various AGE correction tools have been developed to produce expression data free of AGE contamination, including SoupX (Young, 2020), DecontX (Yang, 2020), CellBender (Fleming, 2023), and FastCAR (Berg, 2023). The AGE correction is usually performed in two steps (Figure 2):
- Estimate AGE within a batch, commonly based on empty droplets, as explained above.
- Using the estimated AGE, decompose the expression of every cell into exogenous and corrected endogenous expression. The latter is then used for downstream analysis.
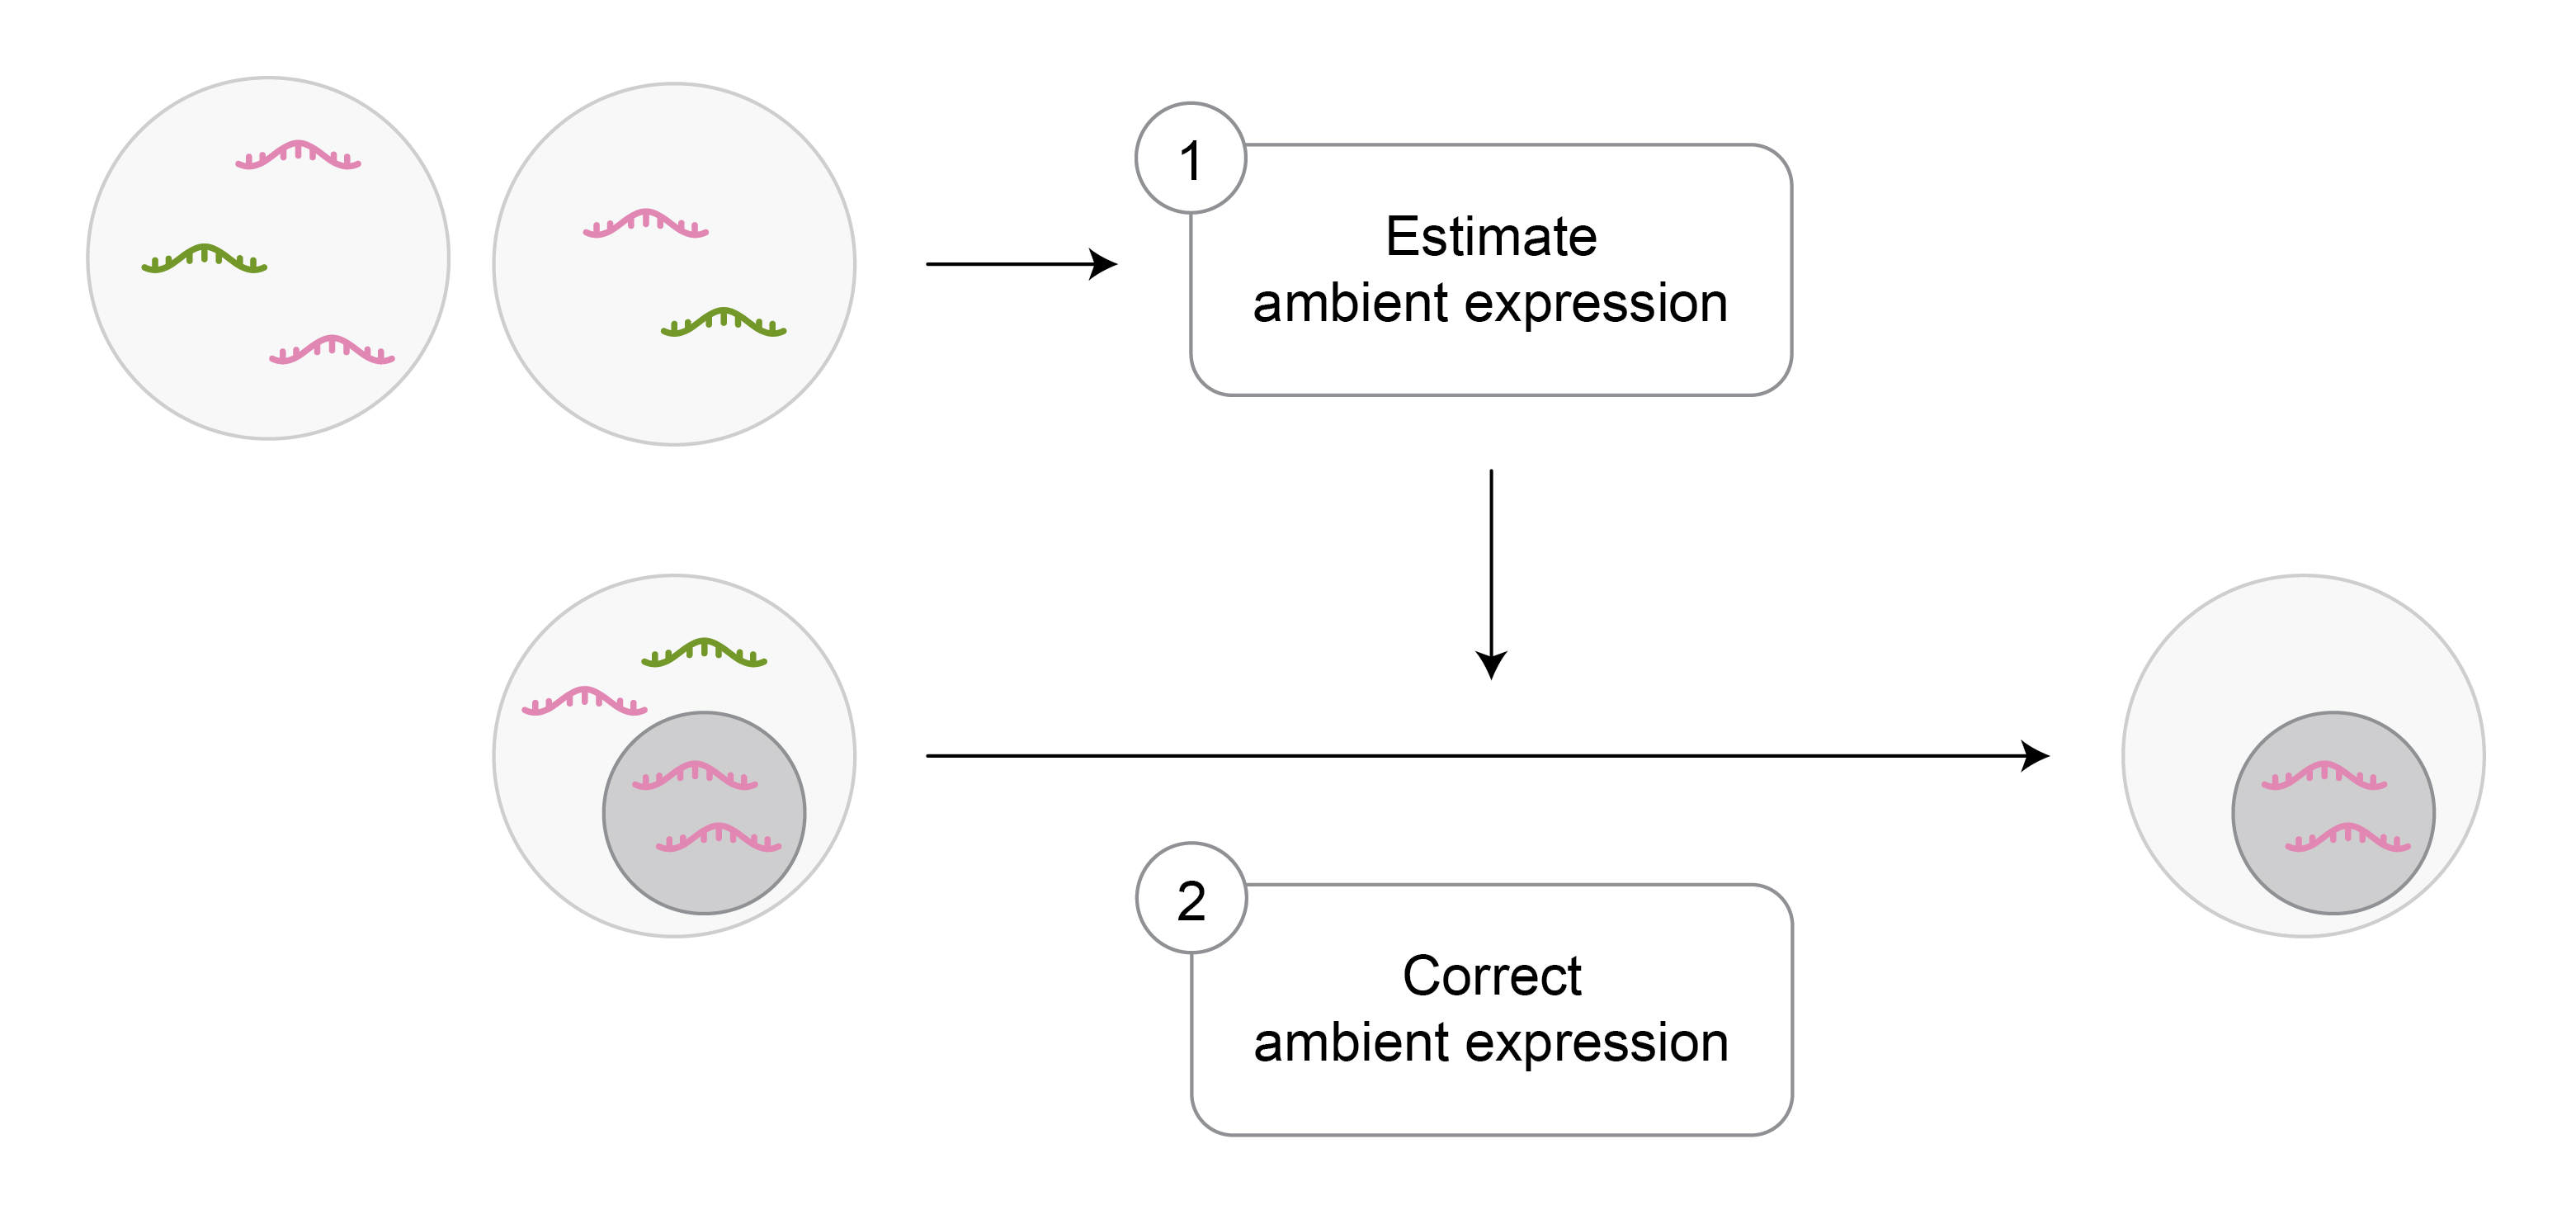 Figure 2: Overview of ambient gene expression correction approach used in most tools.
The modeling approaches used in AGE correction tools differ in multiple aspects, such as:
- The fraction of all exogenous vs endogenous transcripts within droplets (i.e. contamination fraction) can be:
- Directly estimated from the data (Young, 2020).
- Incorporated into a model as a learnable parameter (Yang, 2020; Fleming, 2023).
- The number of exogenous transcripts of a gene can be:
- Estimated only on a per-batch level, being fixed across droplets (Berg, 2023).
- Modeled on a per-droplet level (Yang, 2020; Young, 2020; Fleming, 2023).
- The droplets can be:
- Treated independently (Berg, 2023).
- Expression information can be shared across biologically similar cells (e.g. cell types) (Yang, 2020; Young, 2020; Fleming, 2023). Biologically similar cells can be defined based on discrete cluster membership (Yang, 2020; Young, 2020) or location in continuous transcriptome-based representation space (e.g. cell embedding) (Fleming, 2023).
In addition to the AGE correction tools described above, other alternatives primarily focused on DE analysis are discussed by Amezquita (2021). Briefly, this includes excluding genes whose expression levels are predominately affected by AGE from downstream analysis or eliminating genes whose DE is likely driven by AGE. These two approaches are also further discussed below.
Aligning AGE correction methods with downstream data use cases
When planning ambient correction, it is crucial to consider which downstream analysis the corrected data will be used for. Namely, each ambient correction method has its limitations, which can impact various types of analyses differently. For example:
- Some use cases require accurate correction of individual genes, such as for detecting DE genes between specific biological conditions or for identifying markers of individual cell populations. On the other hand, certain applications require only mitigating the largest AGE differences to reduce the biases within cell representations, such as for cell clustering or data integration.
- Some analyses are performed on a per-batch level, meaning that AGE correction must be truthful and comparable across cells within a batch. However, many analyses include multiple batches, which means that AGE correction must also be comparable across batches.
In my experience, conducting gene-level cross-batch analysis on AGE-corrected data is the most challenging application, as discussed below. I will illustrate this with examples from data integration and DE analysis, the two areas where I investigated AGE correction in more detail.
AGE correction as a pre-processing step for data integration
AGE correction reduces technical variation between batches, enabling the creation of a common representation space (i.e. embedding) where batches are more closely aligned. This process is typically referred to as batch correction or integration in the scRNA-seq community. Besides, AGE correction can serve as a pre-processing step before applying dedicated integration methods, which aim to correct for diverse technical effects. By removing a portion of the technical variation (i.e. AGE), the downstream integration becomes easier.
In this setting, I observed that removing the major ambient effects can already lead to relatively strong improvement. For example, simply excluding the genes with the highest AGE from the features used to compute the integrated representation2 can achieve performance comparable to that of dedicated AGE correction tools (Hrovatin, 2023). However, it is important to note that if no further integration methods are applied and the representation is computed directly from the AGE-corrected data, a different AGE correction approach may be preferred.
A potentially even more effective approach than removing genes with the highest AGE may be removing genes with the highest variation in AGE across batches (Figure 3A). However, this method may prioritize housekeeping genes, which are present in all cell types and thus their AGE is not determined by cell type proportions (Figure 3B). Unfortunately, housekeeping genes typically do not capture cell heterogeneity, defeating the primary focus of scRNA-seq analysis.
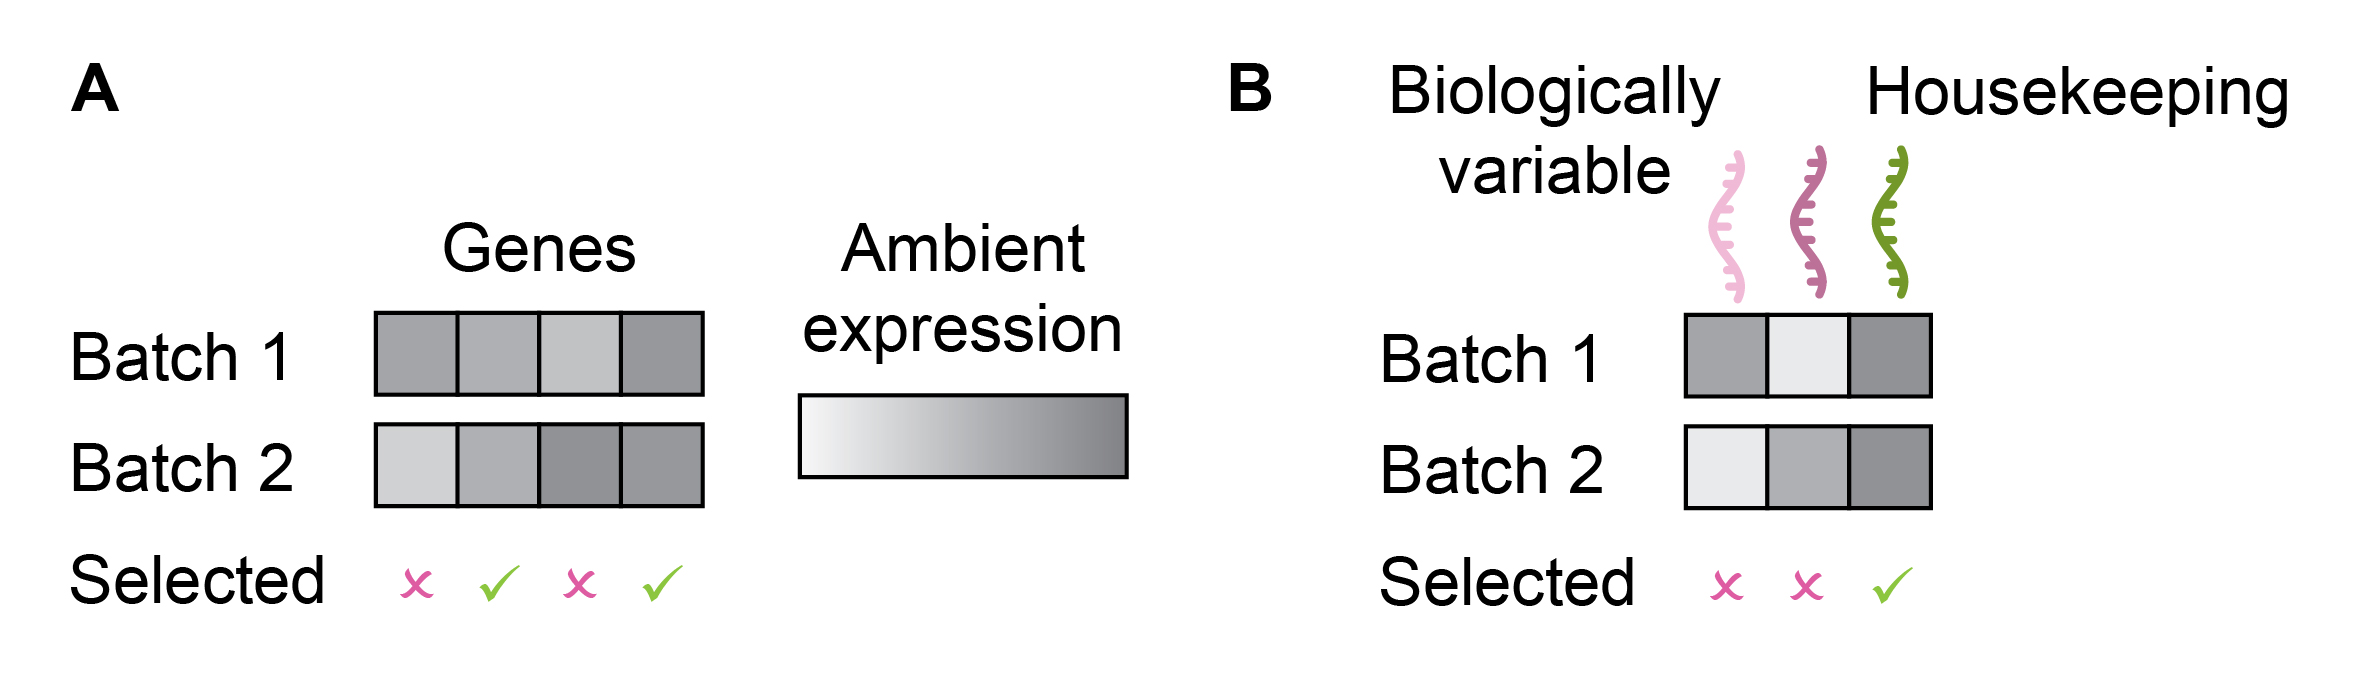 Figure 3: Reducing ambient gene expression biases in cell representation by removing genes with the highest ambient expression differences across batches (A). The limitation of this approach is that it will likely prioritize genes constantly expressed across all cells and subsequently batches (e.g. housekeeping genes). This can lead to the loss of information on biological variation (B).
Note on removing AGE genes
- As noted earlier, the performance was comparable to that of established tools. Therefore, it seemed unnecessary to use more complex methods, whose limitations might also be harder to understand.
- Methods for AGE correction require parameter tuning (Janssen, 2023). The computational cost of filtering ambient genes based on a ranked list is lower than running correction tools multiple times. Ultimately, testing just two or three different numbers of blacklisted ambient genes sufficed for me.
Challenges of AGE correction for DE analysis
Effect of AGE on DE analysis
In the scRNA-seq field, two common types of DE analysis are performed: within-batch and across-batch. They are differently affected by AGE effects and the biases of AGE correction approaches.
The first type of DE aims to identify specific marker genes expressed highly in individual cell clusters. In this case, the same AGE effects are typically present across all compared cell populations, as data of individual batches is split up into clusters. Thus, for this type of DE analysis, it is primarily necessary that AGE correction is consistent between cell types within batches. Benchmarks have demonstrated that AGE correction can be beneficial in this context, as it reduces cross-cluster contamination from AGE (Janssen, 2023).
The second type of DE analysis is more complex, aiming to identify DE genes whose expression differs between groups of replicates (e.g. individuals or animals) with specific biological backgrounds (e.g. healthy or diseased). This type of DE analysis is crucial for answering key biological questions, such as identification of disease targets (i.e. genes changed in disease that could be targeted by therapy) and comparison of drug effects across populations (e.g. between males and females). However, each replicate typically originates from a different sequencing batch, resulting in unique AGE profile in each replicate.
If AGE profiles contain group-specific biases, meaning they are more similar within than between replicate groups, this can lead to false positive genes in DE analysis (Figure 4). Such biases commonly arise due to both biological and technical factors. For example, in type 1 diabetes, beta cells are depleted compared to healthy pancreatic tissue. Consequently, sequencing type 1 diabetic pancreatic tissue will yield fewer exogenous transcripts from beta cells. Accordingly, if we performed a DE analysis on another type of pancreatic cells (e.g. alpha cells) between healthy and type 1 diabetic individuals, cells from healthy samples would exhibit higher gene counts for beta cell markers. These genes would be false positives caused by AGE.
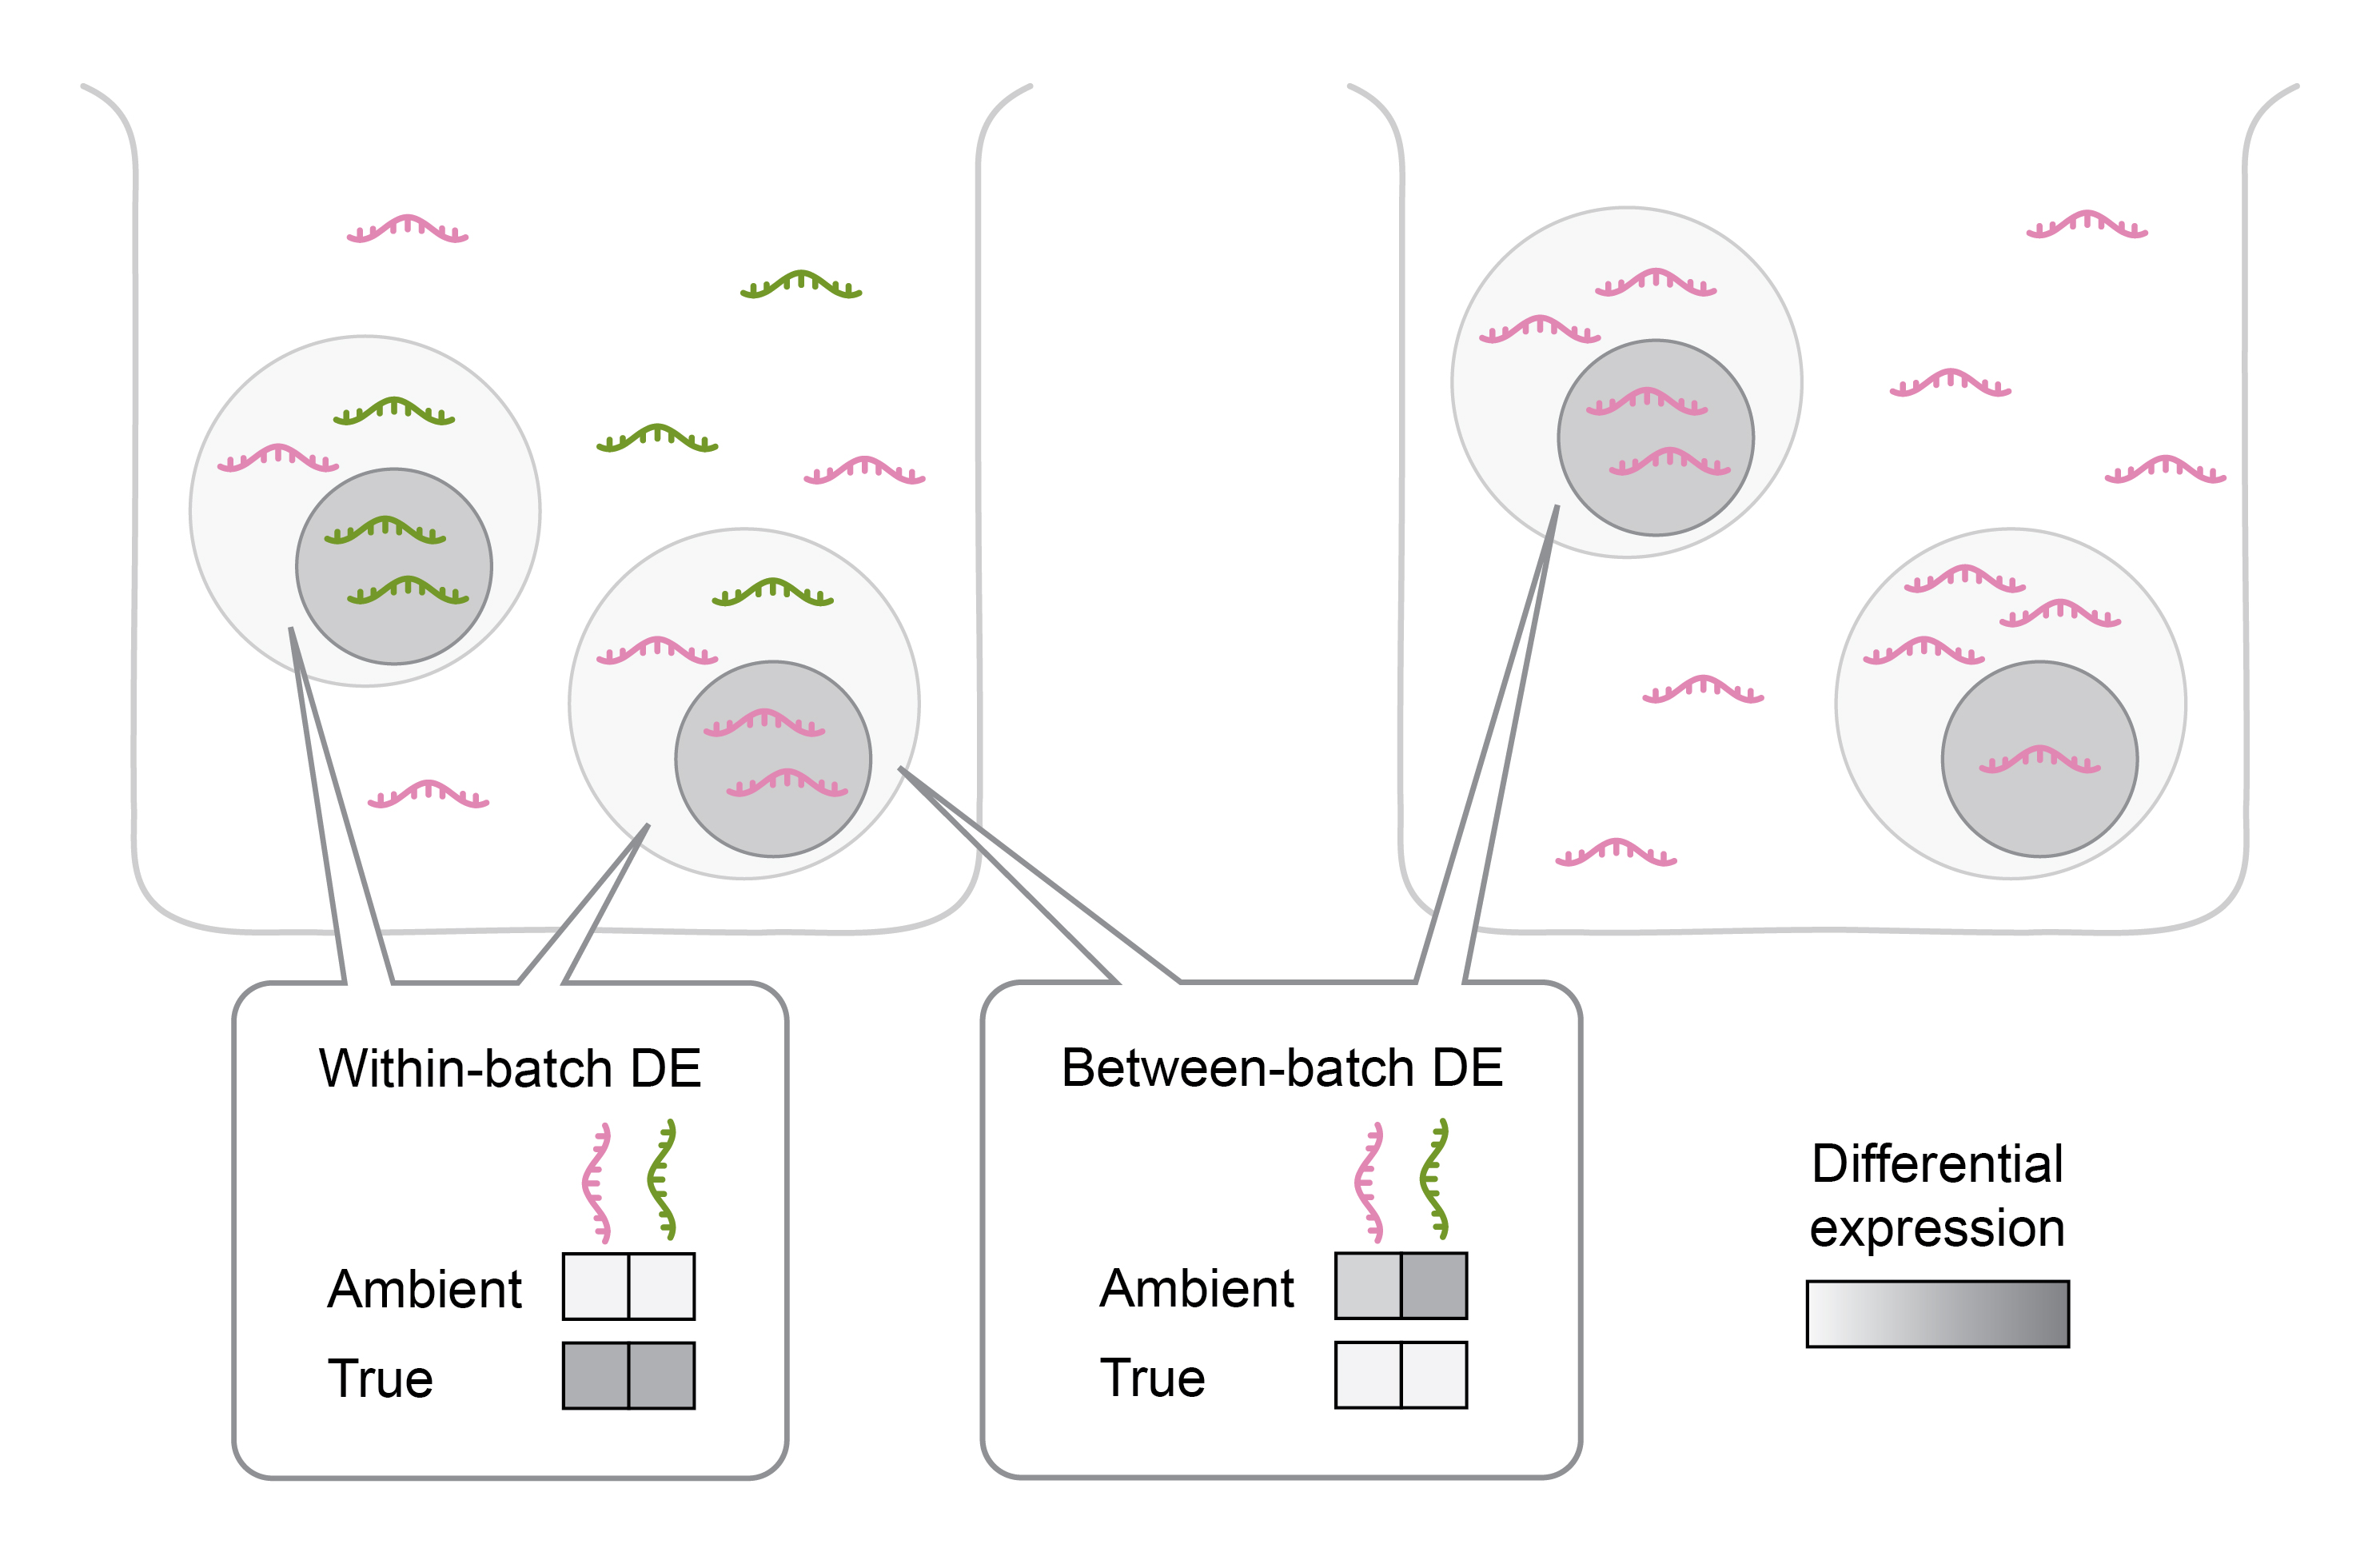 Figure 4: Differential expression analysis between batches is more strongly impacted by ambient gene expression than within batches. DE - differential expression.
Limitations of AGE correction methods for cross-batch comparison
Current methods for AGE correction operate on a per-batch level. While this approach is theoretically sound, considering that AGE is a batch-specific artifact, in practice, this leads to different correction strengths across batches (Janssen, 2023). Such residual differences between batches can adversely impact DE analysis.
The AGE correction methods aim to estimate the strength of AGE in each batch and use this to determine the contribution of AGE to the measured cell transcriptome, as described above. However, these estimates are never perfect (Janssen, 2023) (Figure 5). Indeed, I have observed that the expression of known exogenous genes after correction still varies among corresponding cell types across samples. For example, while insulin (an ambient gene originating from beta cells) was largely removed from alpha cells in some samples, it remained highly expressed in others. This discrepancy is even more pronounced when comparing samples with more substantial technical variation, such as across datasets from different laboratories.
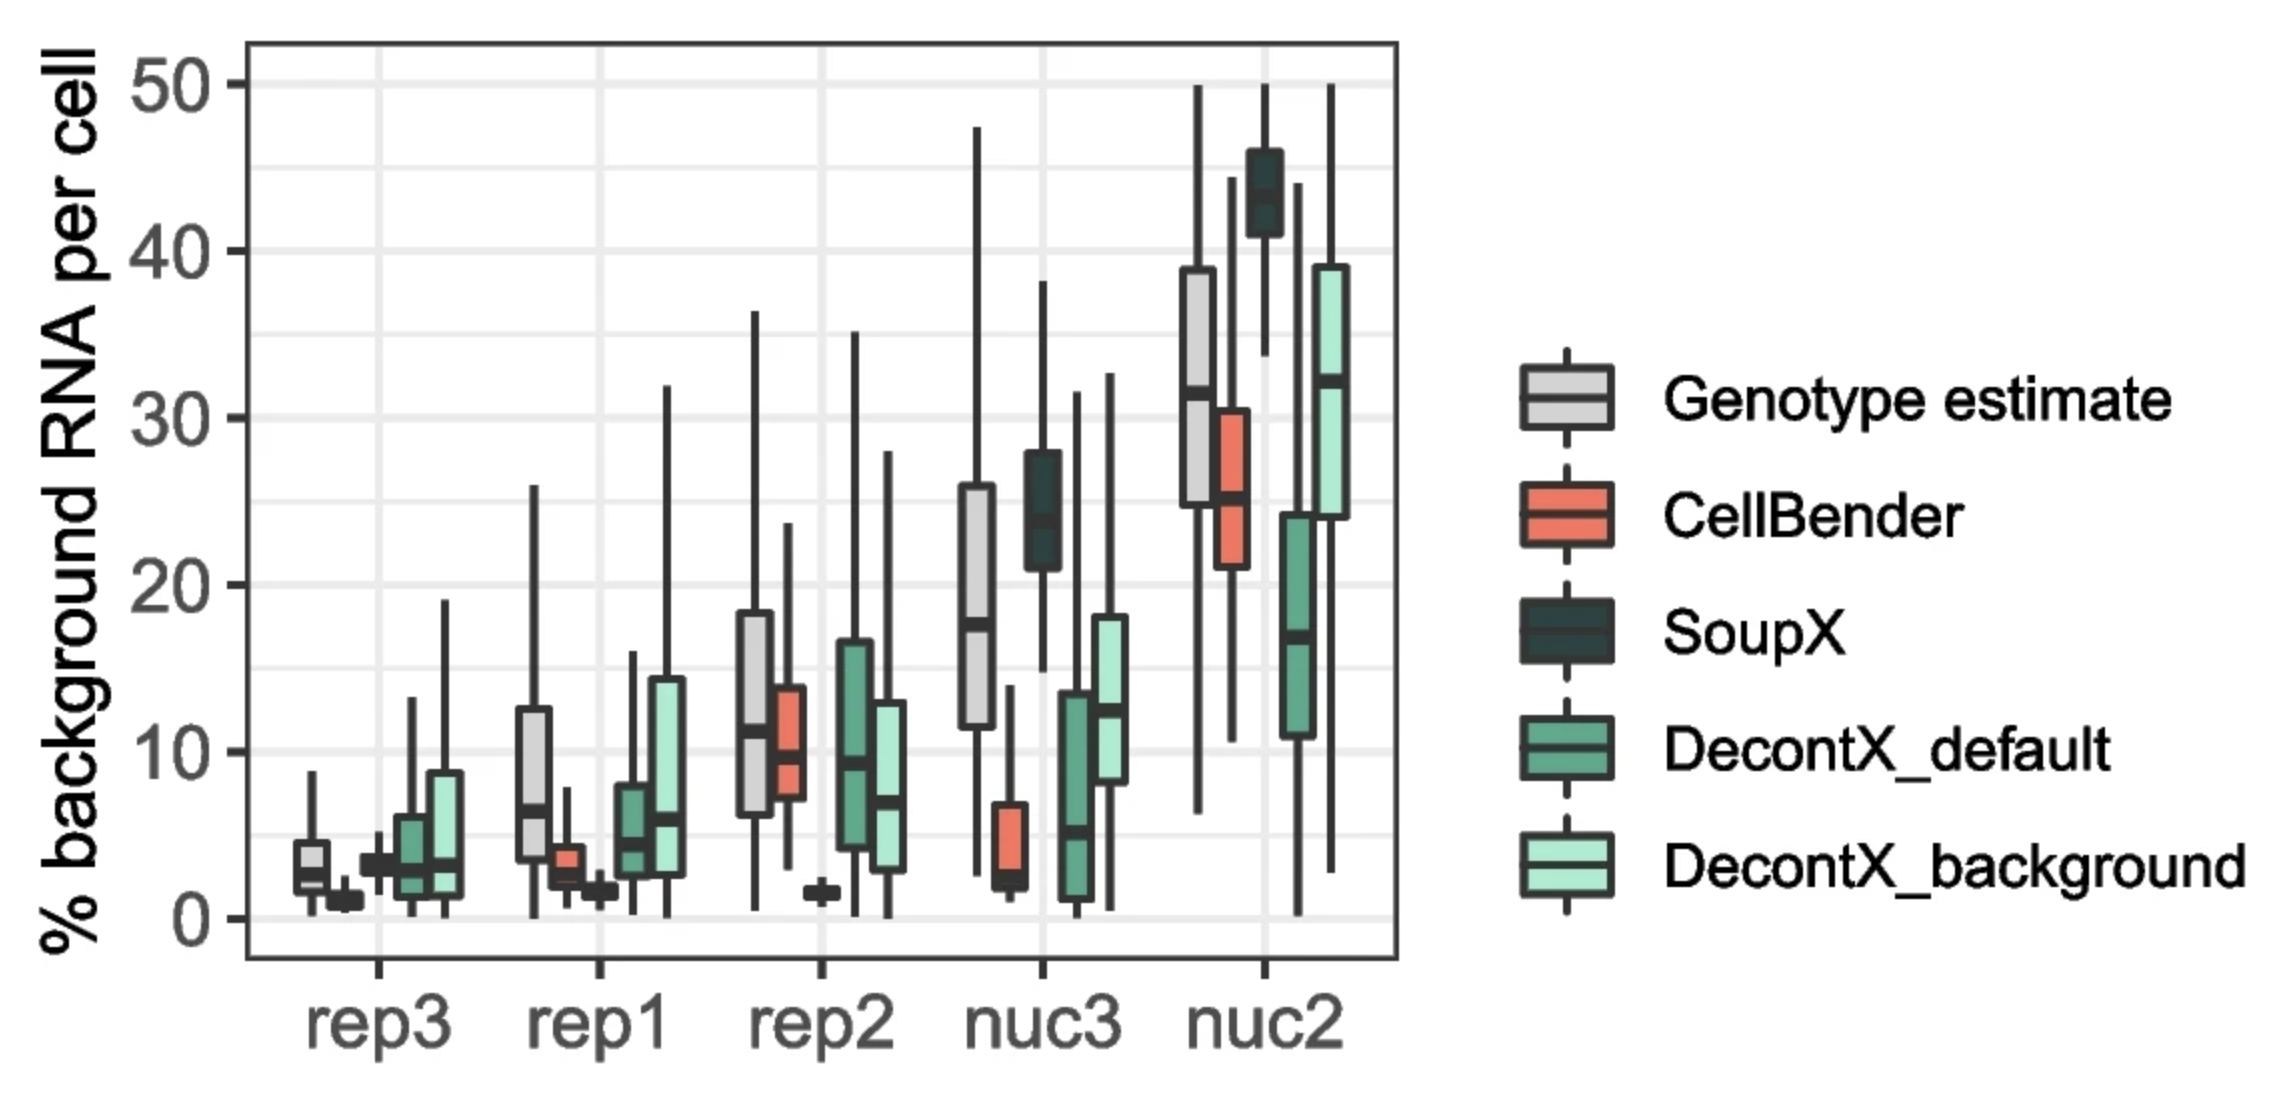 Figure 5: Estimates of AGE contamination often deviate from the actual levels and have different accuracy across batches. Comparison of estimated AGE fraction obtained with different correction methods and the ground truth (genotype estimate). Different batches are shown on the x-axis, with boxplots showing the distribution of estimates across cells per batch. Batches originate from two different sequencing technologies, labeled as “rep” and “nuc”. The plot was taken from Figure 5a of (Janssen, 2023), which is under CC BY 4.0 license.
As long as AGE correction differs across batches, I would not consider it sufficiently reliable for facilitating DE analysis across multiple batches. Evaluations of AGE correction methods have typically focused on within-sample tasks, such as identifying cell type markers and cell clustering (Janssen, 2023; Yang, 2020; Fleming, 2023; Young, 2020; Amezquita, 2021; Huang, 2024). The DE analysis using data from multiple batches was evaluated only rarely. Moreover, when such evaluations have been conducted, they have relied on a limited ground truth, based on only a few known positive or negative genes (Berg, 20203). However, this does not guarantee that most ambient genes are removed from the DE list.
For a while, I was playing with the thought of developing a new method to address this challenge. My primary idea was to jointly model endogenous expression components in similar cells across batches. This concept was inspired by current approaches that share endogenous expression information among similar cells within individual batches. Such a constraint could make the AGE correction more comparable across samples.
Removing likely ambient genes from DE analysis
Depending on how detrimental false positives or negatives are in DE analysis, a more stringent approach to AGE mitigation may be necessary. For example, one of the aims of our DE analysis (Hrovatin, 2023) was to identify targets for laboratory validation, requiring higher reliability. Thus, I used an approach that retains only DEGs less likely to be AGE-driven false-positives.
As explained above, it is assumed that genes are relatively lowly expressed in cell types in which they are of ambient origin compared to cell types where they are endogenously expressed (Figure 6A). Thus, I decided to exclude DE hits with relatively low expression in the cell type on which DE was performed, as they could be AGE-artefacts. The relative expression can be calculated by scaling the expression from the cell type on which DE was performed, based on the cell type with the highest expression (Hrovatin, 2023), representing the endogenous expression levels, and empty droplets (Amezquita, 2021), representing the AGE levels.
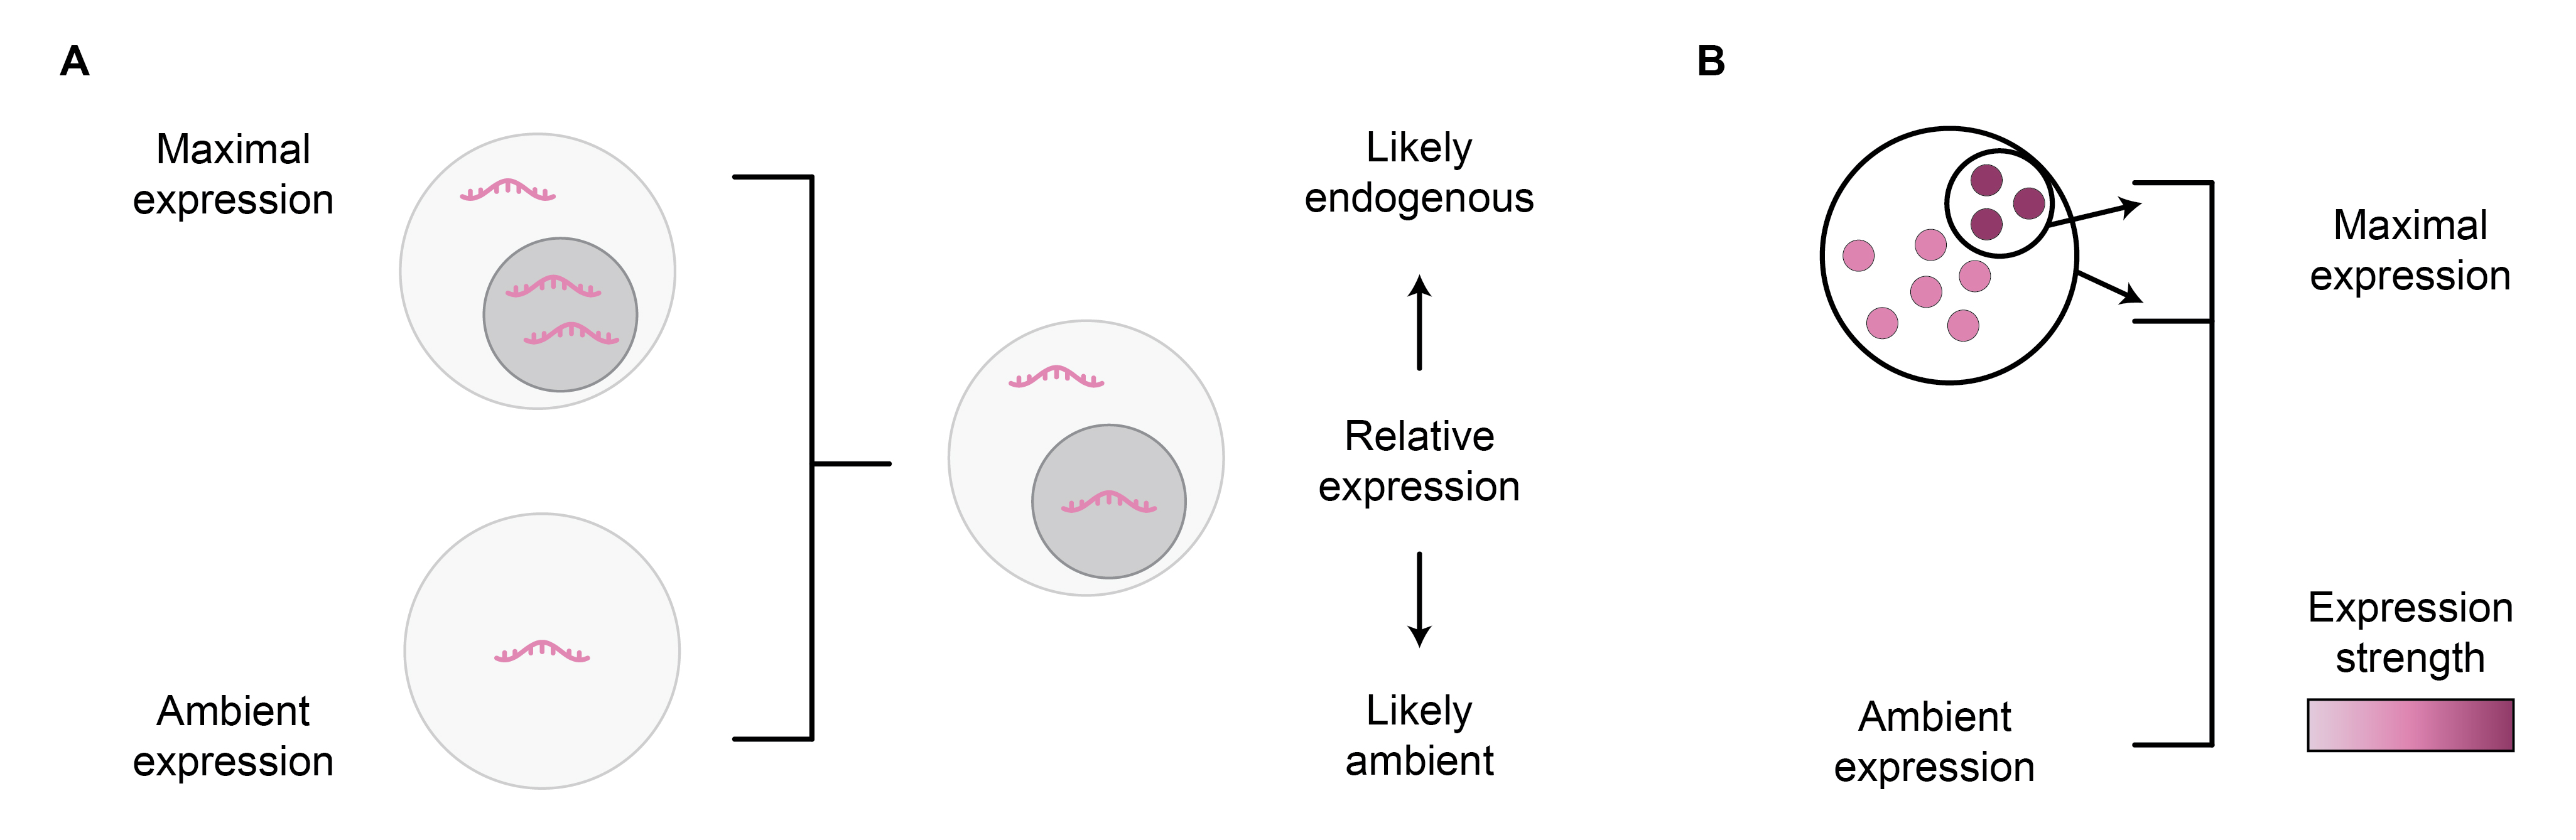 Figure 6: Assessing if a gene may be of ambient origin within a cell population based on its relative expression. Relative expression can be computed by comparing its expression to true ambient expression level in empty droplets and endogenous expression level in droplets with maximal expression (A). The maximal expression level may be underestimated if a too-coarse cell population resolution is used (B).
Of course, this approach also has multiple limitations:
- It is prone to false negatives for endogenous genes with relatively low expression in the target cell type. However, unlike AGE correction applied early in the processing workflow, it allows for the correction strength to be tailored to the specific use case.
- The cell clustering resolution used to determine expression levels in the scaling procedure will affect the outcome. For example, if only a small cluster of cells is endogenously expressing the gene, and the clustering resolution used for cell type annotation is too coarse, the final endogenous expression estimate will be underestimated (Figure 6B). Thus, I performed the calculations using a very high clustering resolution.
- This approach does not evaluate whether the direction of AGE-driven DE aligns with that of the target cell type. An alternative method to address this is discussed in the next section.
Excluding genes whose DE can be explained by ambient DE
To assess whether DE results within a cell type are driven by AGE, they can be compared to ambient DE from empty droplets (Amezquita, 2021). While the comparison could be done post hoc on the DE results of both droplet types individually, a more statistically sound approach would incorporate the ambient levels directly within the DE design.
To determine if the biological condition of interest explains DE beyond the differences in the AGE levels, a likelihood-ratio test (LRT) could be used. The LRT evaluates whether a generalized linear model (GLM) with the additional predictor variable of interest (full model) provides a better fit than a baseline GLM (reduced model) that only includes other predictor variables (i.e. covariates).
To assess AGE-bias in DE, the following GLM-LRT design could be used (Figure 7):
- The outcome variable is the expression of a gene.
- The predictor variable of interest is the biological condition. This covariate is omitted from the baseline model.
- The baseline predictor variable is the AGE of the gene3.
If the GLM model with added biological condition information does not improve upon the model that contains only the AGE factor, this suggests that variation in gene expression can be explained by AGE alone, with the condition factor not having a significant contribution.
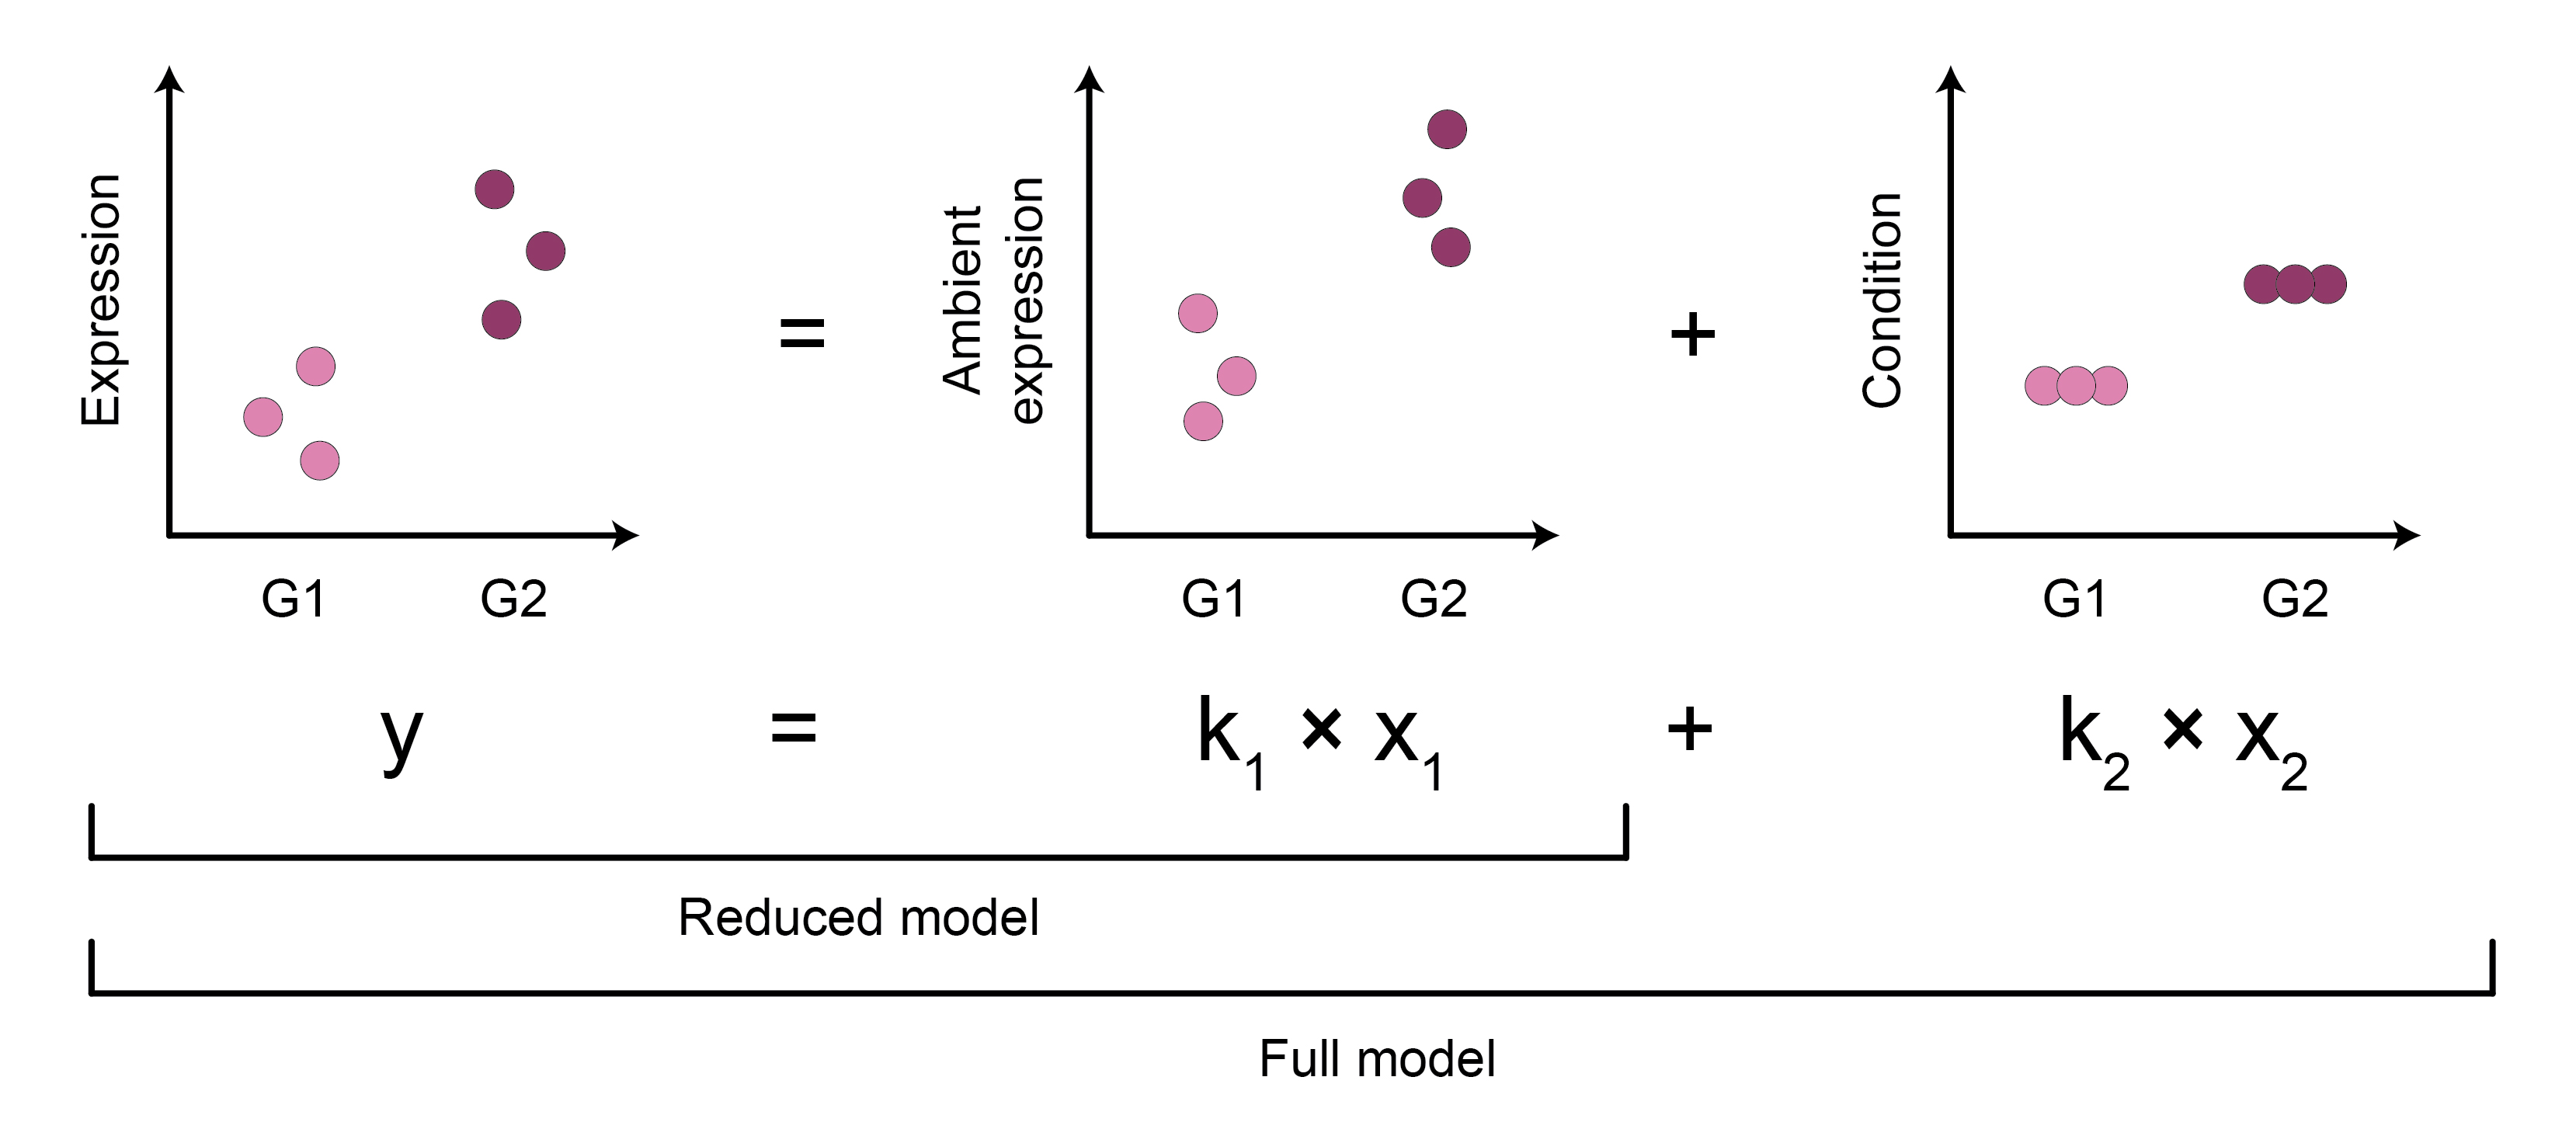 Figure 7: Assessing if differential expression is driven by the condition of interest or ambient gene expression effects using a likelihood ratio test. G1, G2 - condition groups.
However, this approach again has some limitations:
- Custom gene-specific factors (i.e. AGE levels) are not easily used with common DE tools, such as edgeR and DESeq2. Namely, they need to be incorporated in the offset matrix. However, this matrix must also account for other effects, such as the number of reads sequenced for each droplet (i.e. library size) and optionally other gene-specific biases. This complicates the computation of the offset matrix and usually specialized tools are used to generate it. However, I am unaware of any tool that accounts for AGE biases in the offset matrix.
- This approach may overlook genes with similar DE patterns across all cell types. In such cases, the AGE contribution of all cell types will be similar, rather than AGE being a mixture of diverse DE patterns from individual cell types. The latter usually leads to DE patterns not being a direct reflection of DE observed within any individual cell type. Thus, the DE of AGE will match the true DE of individual cell types, leading to insignificant LRT results.
Key takeaways
Different data use cases call for different AGE mitigation approaches. Since most existing tools are primarily designed for within-batch applications, and current workarounds are often suboptimal, it would be great to have a tool designed specifically for removing AGE-biases in cross-batch DE analysis.
Acknowledgements
The ideas presented in this blog post stem from discussions with my former colleagues at Helmholtz Munich, particularly my mentors Maren Büttner and Luke Zappia. I got some suggestions regarding DE tools from Soroor Hediyeh-zadeh and Alejandro Tejada Lapuerta helped to review the post.
References
- Berg, M., et al. FastCAR: fast correction for ambient RNA to facilitate differential gene expression analysis in single-cell RNA-sequencing datasets. BMC Genomics (2023).
- Fleming, S. J., et al. Unsupervised removal of systematic background noise from droplet-based single-cell experiments using CellBender. Nat Methods (2023).
- Hrovatin, K., et al. Delineating mouse β-cell identity during lifetime and in diabetes with a single cell atlas. Nat Metab (2023).
- Janssen, P., et al. The effect of background noise and its removal on the analysis of single-cell expression data. Genome Biol (2023).
- Yang, S., et al. Decontamination of ambient RNA in single-cell RNA-seq with DecontX. Genome Biol (2020).
- Young, M. D., et al. SoupX removes ambient RNA contamination from droplet-based single-cell RNA sequencing data. GigaScience (2020).
- Martin, B. K., et al. Optimized single-nucleus transcriptional profiling by combinatorial indexing. Nat Protoc (2023).
Footnotes
As noted by Maren Büttner, ambient artifacts appear only in certain single-cell sequencing protocols, such as currently popular droplet-based technologies. However, use of other methods may in the future make ambient artifacts obsolete. An emerging example is sci-RNA-seq (Martin, 2022), which distinguishes individual cells based on multiple rounds of mixing small cell populations within wells and uniquely tagging them. Subsequently, all transcripts from a cell have a unique tag combination. The free-floating transcripts are not captured alongside individual cells but rather “mixed away”, thus they do not share tags with individual cells. ↩︎
As the information captured by individual genes is redundant, cell representations are commonly computed on a subset of genes. Thus, genes that may contribute less to cross-batch differences can be prioritized. ↩︎
To be precise, AGE should be incorporated as an offset variable rather than a normal predictor variable. However, explaining this is beyond the scope of this post. See this discussion for more information. ↩︎